For further information don't hesitate to visit our presentation on Prezzy.
http://prezi.com/qwrzdzanefi0/?utm_campaign=share&utm_medium=copy
Treasure
hunts are useful strategies for acquiring information about a particular topic
and practice skills and procedures related to ICT and accessing the information
via Internet.
They
allow us to improve reading
comprehension of students and teach them to search the Internet. The could
place on a level below the Web Quests because Web Quest don't ask students for
solving a problem, or exposure conclusions.
In
English there are many websites with collections of "Treasure Hunts"
made by teachers at all levels and areas. If we make any Google type search
string "treasure hunt" "scavenger hunt" or "knowledge
hunt" find thousands. In Spanish but there are few but gradually becoming
popular in Spanish-speaking countries and more and more in our language.
So
they have some differences; A "treasure hunt" is also used as an
educational resource, but is simpler. In them, students are given answers to
questions, with particular relevance to the "final big question."
Being more specific, the "treasure hunts" are considered more
appropriate for younger students. A Webquest, on the other hand, involves a
process of investigation and processing of the information obtained, leading to
conclusions that are not always just answer factual questions.
Im going to explain the
one that we have liked most:
+Name: “What happen the day I was born?”
+Description:
see what happened on the day and year you were born.
+Stepts:
1º Enter your born date in the space
2º Click the button that says “Quick
Page”
3º You will automatically
+Conclusion: The
purpose of these task is to improve Reading comprehension and to improve their
expression in their writting.
-Treasure hunt for primary education:
- Cartographic projections: Robinson, Mercator and Azimuthal:
-Robinson:
http://www.youtube.com/watch?v=n8zBC2dvERM
Purpose:
The Robinson projection is a map projection of a world map which shows the entire world at once. It was specifically created in an attempt to find a good compromise to the problem of readily showing the whole globe as a flat image
Distortion type and the areas more distorted:
The distortion close to the poles is severe, but quickly declines to moderate levels moving away from them. The straight parallels imply severe angular distortion at the high latitudes toward the outer edges of the map, a fault inherent in any pseudocylindrical projection
Is there more of one version?
The Robinson projection can best be described as being pseudocylindrical, but given its unique method of development, it does not fall perfectly into any known form category
Problems:
-Compression:
Robinson projections are not equivalent; they do suffer from compression. However, the amount of area distortion is generally low within about 45° of the equator.
-Equivalence:
Robinson projections are not equivalent; they do suffer from compression. However, the amount of area distortion is generally low within about 45° of the equator.
-Conformality:
The Robinson projection is not conformal; shapes are distorted more than they would be in a truly conformal projection. However, shapes are not distorted very badly within about 45° north or south of the equator or within about 45° of the map's central meridian.
-Equidistance:
The Robinson projection is not equidistant; there is no point or points from which all distances are shown accurately.
-Azimuthality:
The Robinson projection is not azimuthal; there is no point or points from which all directions are shown accurately.
Socio-cultural implication of using it as a learning resource:
Robinson projection provides a view of the occidental part of hearth pushing it up and excluding the rest of the hearth. However, this is one of the most realistic point of view represented in a bidimentional map that can be well representated by student.
b) Purpose.
Mercator presented his map to shipping. The Mercator
projection is a cylindrical projection of a spherical surface. And Mercator had
to perform calculations for projection was useful in navigation.
This was because the Mercator map has straight rhumb lines used for sailing.
c) Distortion types.
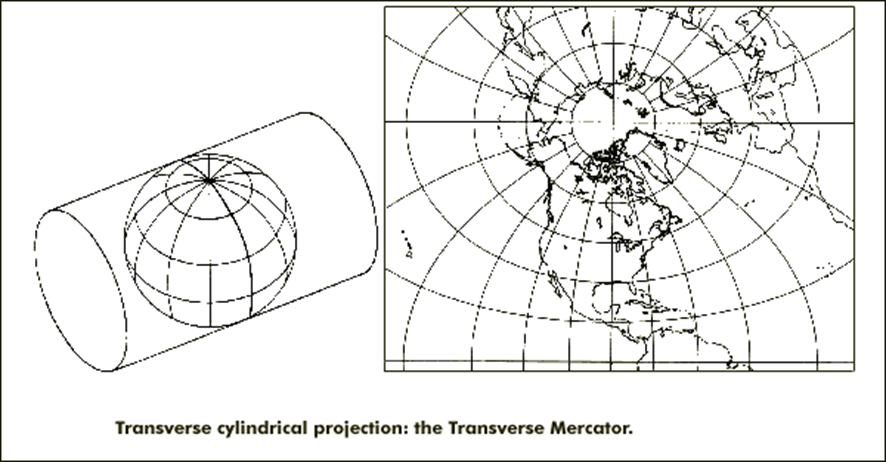
- -Transverse Mercator projection.
The cylindrical projections discussed is formed by placing a cylinder in contact with Ecuador, and even when often used to portray the earth as a whole, are optimal for use in regions of Ecuador. For those parts of the land that are not close to Ecuador, you have the option of turning the cylinder on its side and do nip a particular meridian. A projection is made so-called transverse cylindrical projection and can be based on any chosen central meridian.
Again, a set of rules is proposed to produce either equal areas, equal distances or conformal projections. Of all these the most important is the transverse Mercator, which results from projecting the sphere in a cylinder tangent to the central meridian, an example of which is shown in the figure:
- - -Oblique Mercator projection.
The following final classification of the cylindrical projections used where one country or region to be mapped is longer in one direction than another but is not aligned along any meridian or parallel . In this situation it is possible to formulate an oblique aspect of the Mercator projection to minimize the scale factor resulting in an oblique cylindrical projection as not equivalent. It's a regular Mercator projection was altered, wrapping the sphere with a cylinder so that it touches the surface along the great circle path chosen instead of along the terrestrial Ecuador . Setting this projection is necessary to specify the azimuth of the center line and all other parameters discussed above. The scale factor is now proportional to the secant of the distance from the centerline. An example of using this projection is in Peninsular Malaysia, where the projection is called oblique Mercator or antisymmetric Hotine orthomorphic .
d) Distortion areas.
The Mercator map also preserves its linear scale in all directions. This subsequently allows minimal distortion of shape and angles of small areas. However, the size and shape of large objects - Greenland or Antarctica for example - are largely distorted. It is originally believed that Geradus intended for the map to be used for nautical purposes, not as a map of the world like it often is. When used as a view of the world’s landmasses, it can drastically alter how people view relative size and shape if they are unaware of the maps characteristics.
The shape distortion is now extreme to the poles and that, in addition to scale factor along parallel, also the distortion along the meridians.
The map also shows Alaska to Brazil a similar size, when the area of Brazil is almost 5 times higher. The same also appears to Alaska 3 times larger than Mexico , where the latter is almost 250,000 km2 larger . Even Europe appears relatively the same size as South America where it is more than 7.2 million km2 larger.
Proportions in the Mercator map.
-The dimensions. To his critics, this disproportion in the size of the countries near the poles (many of them agree with the great economic powers of the world and the least developed countries are around Ecuador) creating and perpetuating a Eurocentric prejudices or occidentalcéntrica conception , giving a feeling of European and American centrality.
-North-South divisions. The second major criticism of this projection is the Mercator map gives more weight to the northern hemisphere to the south , placing the line of Ecuador not in the middle of the map, but a little lower, so the northern hemisphere occupies 2 / 3 of the surface of the map, and the southern third , in addition to place Europe at the center of the map itself.
-Locating countries. There is another misleading aspect to mention Mercator map : countries are not where we think they are because " Europe and North America should be much further north than where they are. Are centered on the world map , practically in Ecuador , when many more degrees north.
e) Versions
A further refinement of this projection is to retain ownership of equal areas but change the shape, using an extra along parallel and along the meridians scaling. This leads to what is usually referred to as the Peters Projection, often used by international organizations showing countries of the world in their correct relative sizes.
The Gall- Peters projection is a cylindrical projection, with all the disadvantages that implies. To his supporters have the advantage that the Gall- Peters projection is a projection that preserves areas. This means that the vertical dimension map stretches or shrinks in a particular way to get the area of objects is preserved at the expense of producing severe distortion in the shape of the continents. So, you can compare sizes of distant objects together as well as if we were looking at the globe. Apparently, when Gall proposed this projection for the first time did not achieve great popularity but Arno Peters was luckier and managed to even the UN adopted its projection. This success was more due to political and social issues that cartographic merit.
Being a cylindrical projection, this projection also produces a deformation of the continents as we change latitude . In this particular case, this distortion is to get away from the latitudes 45 ° N and 45 ° S. Should see the Tissot indicatrix of this map to get an idea of the deformation. Although this new map drawing is very close to the dimensions of the continents, the academic cartographers ignored considering this unscientific projection for that stretch unreal shapes. The main criticism of the Gall- Peters projection is thus distorting the shape of the countries.
f) Problems
Correctly represents the so-called first world-North America and Europe, while Africa and South America appears very small. As an example, it says that Greenland, with 2.1 million square km, is the Mercator projection, larger than Africa, which has about 30 million square km.
Appear as the first contradictions. Was not the favored first world? Did anything special predilection for Mercator practically uninhabited Greenland?
Mercator placed Europe at the center of the map and moves the line of Ecuador down by ideological, political, or colonial power.
Whoever believes and probably unaware that, in fact, is criticizing a partial map of Mercator. Known as the Mercator map, is the line in the center of Ecuador. This is based on the Mercator projection, complete map.
Another problem: are produced big deformations in the representation when we arrive to the Poles. When we’re nearer to the North Pole, less accurate is.
g) Socio-cultural implications of using it as a learning resource.
In this projection, we can observe that Europe is
bigger than other countries, so in other words, they are more concentrated in
Europe. An example is that Germany is bigger than Kenya, but it isn’t true.
Kenya is bigger than Germany. On the other hand Greenland is biggest that
Africa, here occurs the same than in the other example, Africa is much bigger
than Greenland. So those distortions are projected in this map and this
projection is the one that, in Spain, is more used.
-Azimuthal:
Picture:
Purpose:
The purpose of this kind of map is to show correctly the great circle distance and bearing from the center reference point. Besides, it presents the true direction to any other points.
Azimuthal´s map lets us have a more world vision real, since it is measured on the sphere.
Distortion – Types?
There are different types of projections depending on which perspective we choice it.
Azimuthal Orthographic Projection
It takes this light path
So, the world would be seen:
Azimuthal Stereographic Projection
It takes this light path
So, the world would be seen
Gnomonic Projection
It takes this light path
So, the world would be seen
General Vertical Perspective Projection
It takes this light path
So, the world would be seen
Distortion – Areas that are most distorted?
Each distortion has different distorted areas. For example:
The Gnomonic projection has an extreme distortion far from the center. Also, it shows less than one hemisphere.
Stereographic projection Map is infinite in extent with outer hemisphere inflating severely, so it is often used as two hemispheres. Maps all small circles to circles, which is useful for planetary mapping to preserve the shapes of craters.
Orthographic perspective has a view from an infinite distance.
Vertical perspective is viewed from a finite distance. So, it can only display less than a hemisphere.
There is more than one version?
Problems?
While such a projection preserves the directions, the shapes can be more than distorted.
Also, the distance between any other points may not be correct at all.
Socio-Cultural Implications of using it as a learning resource?
Azimuthal projection is the projection that is closer to reality because it respects the true distances and proportion. However, if we glance it on a paper, maybe we won´t obtain a world´s image clear. To clarify it, we should use some digital format which could show us in 3D.
- Google maps & Maps (Apple)
It uses
a similar alternative of the Mercator projection that is the reason why Google
maps are not able to show precisely the areas around the poles.
Nowadays, Google
is receiving plenty of messages asking why does the most sophisticated information
technology company in the world use the most distorted and archaic world map
known to humankind?".
I have found an answer made by
one of the Google’s employee “Joel H”.
“Thanks
for the feedback. Google maps use Mercator because it preserves angles.
The first launch of Maps actually did not use Mercator, and streets in high
latitude places like Stockholm did not meet at right angles on the map the way
they do in reality. While this distorts a 'zoomed-out view' of the map, it
allows close-ups (street level) to appear more like reality. The majority of
our users are looking down at the street level for businesses, directions,
etc... so we're sticking with this projection for now. In the meantime, you
might want to look at our favourite 3D view of the world”.
Maps (Apple)
Map Kit uses a
Mercator map projection, which is a particular kind of circular map projection
like the one shown below. In a cylindrical map projection, the coordinates of a
sphere are projected onto the surface of a circle, which is then unpacked to
generate a flat map. In this projection, the longitude lines that commonly meet
at the poles become parallel instead, causing land masses to be twisted as you
move away from the equator. The advantage of a Mercator projection is that the
map content is scaled in a way that benefits general navigation. Specifically,
on a Mercator map projection, a straight line drawn between any two points on
the map yields a course heading that can be used in actual navigation on the
surface of the Earth. The projection used by Map Kit uses the Prime Meridian as
its central meridian. ( Apple- 2013)
- Two countries situation in different projections
GERMANY:
Surface: 357.021 km²
In the Mercator´s projection
we can see that
Observing Germany in the Mercator´s projection we can see that it
occupies France, part of Australia, Poland and other countries. This is because
Mercator was from Germany so he gave more importance to his country, taking
parts of the countries around it.
While the different projections change, Germany gets its real size, until
it reaches an approximate dimension to the real one.
BOLIVIA:
Surface: 1.098.580 km².
If we observe the Mercator´s
projection, we can see that Bolivia occupies part of Argentina and Paraguay in
its real dimension. So it is like three times bigger than its real size.
Mercator exaggerate a lot of dimensions, the developed countries were the
biggest ones.
Bolivia becomes smaller while the
different projections change, so fortunately it gets its real size, without
stealing pieces of land to other countries.
- A media that we think can distort the vision of students
Special
Effects
These techniques are
designed to create a visual illusion through which the viewer attends scenes
that can not be obtained by normal means , such as space travel or the
transformation of a man into a werewolf. Special effects can be used to
represent objects or beings exist , such as a dragon, different techniques are
often used in the same plane or scene to achieve the desired effect and the
special effects are often "invisible" is say that the viewer does not
realize that the image or sequence you are seeing is actually a special effect.
This can
influence the perception of children on reality and be confused , often can not
distinguish the reality of difficult fiction to their age and who have very
developed imagination and this can create behavioral problems in children.
To avoid the problems
that this can cause in children's behavior have to explain that it is only
fiction and does not exist in real life , to encourage watching movies without
special effects or just to compare and are well aware of the reality .
About Azimuthal,
Robinson and Mercator projections, we have reach the conclusion that we would
use them three but changing between them at each age period.
We would use
Mercator projections at early ages, when for children it’s easier to have a
global vision of all world
When children are a little older we would use Robinson
projection, because they would be able to understand the distortion in some
zones.
Finally when children get older we would use Azimuthal
projection because it is more realistic but it hasn’t got a global vision of
all the world at same time so we think it would be hard to children to
understand it on early ages.